Technical analysis is the study of historical prices, and sometimes volume or tick activity, to describe the current state of a market and to plan possible scenarios. In forex, where traders watch highly liquid currency pairs on short and long timeframes, charts are often the main workspace. The method is widely used, but it is not a forecasting machine. Past prices do not guarantee future prices, and two analysts can read the same chart in different ways.
This article introduces the building blocks: chart types, trend structure, support and resistance, common indicators, and a cautious way to combine them with risk rules. The goal is literacy, not a signal list.
Charts and Timeframes
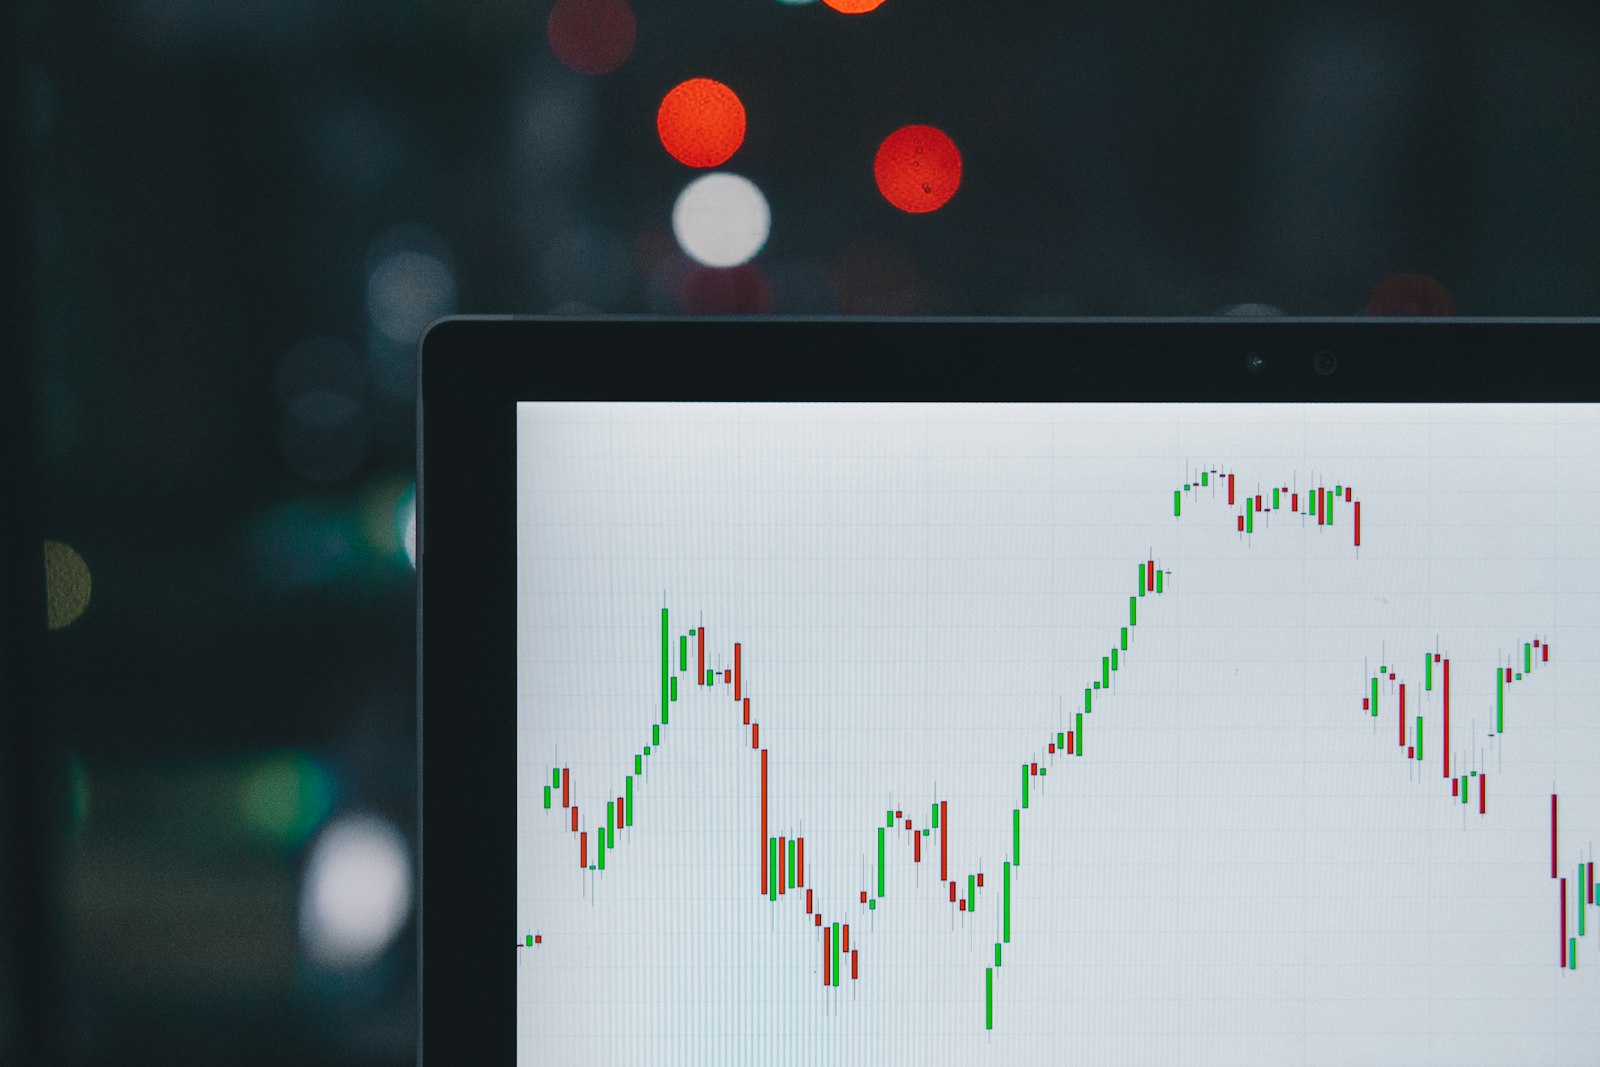
Most forex platforms offer line charts, bar charts, and candlestick charts. Candlesticks are popular because each bar shows the open, high, low, and close for a chosen period. A four-hour candle summarizes a different story than a five-minute candle. Higher timeframes often describe the broader direction, while lower timeframes show shorter swings inside that direction. A setup that looks clean on a five-minute chart may be a minor pullback on the daily chart.
Choose a small number of timeframes and stick to them while you learn. Constantly switching intervals can create the illusion of certainty: there is almost always a chart that appears to support a preferred idea. Consistency matters more than finding an exotic chart type.
Trend, Range, and Market Structure
A simple description of structure asks whether prices are making higher highs and higher lows, lower highs and lower lows, or moving sideways between roughly similar highs and lows. Uptrends, downtrends, and ranges can persist for a long time, and they can end without a clear warning. Drawing swing points on the chart is one way to make that description visible and to notice when the pattern changes.
Breaks of structure are often discussed as potential turning points, but a brief break can be a false move. Waiting for a close beyond a level, or for a retest, is a common way traders try to reduce impulsive entries. None of these filters removes the possibility that the next candle will reverse.
Support, Resistance, and Round Numbers
Support is an area where buying interest has previously slowed a decline. Resistance is an area where selling interest has previously slowed a rally. In forex, psychologically important round numbers, prior session highs and lows, and obvious daily or weekly closes often attract orders. These zones are areas, not always exact prices. Treating a level as a single pip can lead to stops placed where many other stops already sit.
Once a level is broken, traders sometimes expect it to change role — old resistance becoming support, or the reverse. That pattern appears often enough to be studied, but it does not occur on demand. Always define where the idea is invalid and size the trade accordingly.
Indicators: Helpers, Not Oracles
Moving averages, the relative strength index (RSI), MACD, Bollinger Bands, and ATR are among the tools found on most platforms. A moving average can help describe direction or dynamic support and resistance. RSI can show when a market has risen or fallen quickly relative to its recent history, which is not the same as a reliable turning signal. ATR measures recent volatility and can inform stop distance, not direction.
Indicators are derived from price. Adding many of them can repeat the same information in different colors and create a false sense of confirmation. If you use indicators, know what each one measures, and avoid changing settings after every losing trade. A simpler chart, with a written rule for entry, invalidation, and position size, is usually easier to review honestly.
Price Action and Common Patterns
Price-action traders focus on candles and structure, such as pin bars, engulfing candles, inside bars, or simple pullbacks in a trend. Chart patterns such as triangles, flags, and head-and-shoulders formations are also part of the traditional toolkit. These patterns are descriptions of crowding and hesitation. They can fail, especially around news, and a textbook shape does not imply a textbook outcome.
Back-testing a pattern requires care: costs, spread widening, and skipped trades in thin liquidity can change the result. Forward-testing on a demo, with a journal, is often more informative than hunting for a perfect historical win rate. Even a careful test cannot ensure future performance.
Limits of Technical Analysis
Charts do not include every force that moves currencies. A surprise policy decision, a geopolitical event, or a sudden change in risk appetite can overwhelm a tidy setup. Technical analysis also suffers from hindsight bias: trends look obvious after the fact. For these reasons, many practitioners combine chart work with an economic calendar and strict risk limits, or they simply stand aside when major announcements are due.
Conclusion
Technical analysis can help you describe trend, locate areas of interest, and plan where a trade idea would be wrong. Candlesticks, structure, levels, and a few well-understood indicators are enough to begin studying the subject. They do not predict the market with certainty and they do not replace risk management. Use charts to organize decisions, keep records of what you actually did, and treat every pattern as a possibility rather than a promise.
Risk disclaimer: Forex and other leveraged currency trading involve a substantial risk of loss and are not suitable for every investor. You can lose some or all of your capital, and losses can exceed your deposit when leverage is used. This article is for educational purposes only and does not constitute investment, trading, or financial advice. Past performance is not a reliable indicator of future results. Consider your own financial situation and, if needed, seek independent advice before making any trading decision.